Ian McDougald from The Brand Factory shared his experience of getting started on Bionic and how he used it to discover and cash in on a key insight about consumer purchase behavior.
At Bionic, we believe that extra steps in getting advertising work done stands in the way of better advertising results.
Disconnected manual steps and visual cues divert excessive mental energy towards sifting through details – placing incredible limitations on creative thought processes and clarity in logic.
Science, specifically experimental psychology, supports this.
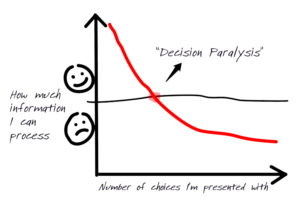
According to Hick’s law, the more information you are faced with, the longer it takes you to make a decision.
Another simple fact? In our ferociously competitive industry, making the right choices as quickly as possible helps us keep clients, help them sell more product, and win new deals. Giving your brain space to process the right information at the right time helps you do that.
Introducing Ian McDougald
Meet Ian McDougald from The Brand Factory – a new Bionic customer. He has one of the dirtiest stories we’ve heard so far about what happens when you make a simple change to the way you do things (and yes seriously, it has to do with dirt).
The most basic point? Spend your time doing valuable work. Not drowning in a deluge of detail.
Q: Tell us about the Brand Factory and what you do.
A: I’m Ian from the Brand Factory. We’re a 40+ person digital media agency in Toronto, Ontario.
It’s pretty awesome working here.
I work as a Digital Media Specialist developing and executing digital ad campaigns for a number of clients like Friday Harbour, Aspen Ridge Homes, Less Mess Soil and more. I manage digital buying and planning across a number of platforms like Google AdWords, Facebook, Twitter, LinkedIn and other platforms and develop high-end analytics reports to adjust, optimize and track all digital campaigns.
Q: How long have you been on Bionic?
A: I’m two weeks into using Bionic, and I’ve been using the Performance Management tool for about a week now.
Q: What made you want to find a new way to manage your work?
A: I just need to have all the information and all the visualization in one concise platform.
For me organization is king.
You lose the opportunity to catch things in the data when you are jumping between a bunch of spreadsheets and a bunch of interfaces and managing multiple campaigns for multiple advertisers. There are real limitations to what you can think about when you have so many documents and systems open at the same time. I manage so many campaigns and so much data that it’s really, really important I can see things quickly.
Q: What’s the best thing that’s happened so far?
A: We have a client who sells soil that is delivered to your house. So, I’m running a Google AdWords campaign to help them drive more sales. With Google AdWords, of course you have all the data for performance, and we’re always trying to optimize as much as possible.
Bionic helped me configure an integration with AdWords, so all the data flows into the performance auditing tool, which is aligned with the plan and goals that I set up for this particular campaign. This visualizes the performance data against my plan in a meaningful, efficient way.
The first thing that jumped out to all of us was that the campaign was performing better on Sundays than the other days.
Why? In retrospect, a lot of people are gardening on Sunday so it occurs to them to search and buy then! That’s when they are literally looking for dirt, and it is the best time of the week to help them find it.
But, we couldn’t see it easily and clearly in the data until we had it in Bionic – and there it was and we narrowed in on it. So, we adjusted to prioritize spend and increase budget on Sundays, and we’ve seen a really healthy increase in results. The information was all there before, but it just wasn’t clear enough or obvious enough given the number of campaigns we work on – and now it is.
Q: How has it affected your experience of your job and the quality of your work so far?
It just feels really professional whereas the spreadsheets just don’t look as nice. I’d say that it’s made the media planning process more fun. It actually almost gamifies the whole process. I’m going into AdWords and I’m optimizing campaigns to make sure I’m hitting the goals that I set in Bionic. It makes my work more interesting and enjoyable.
When it’s all in one visually appealing and concise platform, you see things in the data that you probably won’t otherwise. I just need to have all the information and all the visualization in one concise platform about what we’re doing and how it’s working.
I think I’d really just want to stress the organization aspect of this and the fluidity of having your data update every day, automatically. The limit of clutter has been the absolute best.
It’s really been nice and it isn’t an additional software that you have to have as an application on your desktop, it’s web-based, it really has made a difference in my day and it’s a very strong platform. For me, organization is always king and it’s really helped quite a bit on that end. I can build out our media plans in full on Bionic, and basically we have a lot of campaigns that run monthly and a lot of campaigns that are ongoing.
Like I said earlier, it’s just the limitations of how many documents you have to have open at the same time. When it’s all under one concise platform, you’re not losing the opportunity to catch something in the data that you might be if you’re jumping between a bunch of spreadsheets and a variety of different clients.
Seeing and tracking what is happening makes a difference. Seeing the goals against the spend helps make the information be presented to me in a better way. Even just the ability to have all the advertisers right there with their logos, it’s the small things that really do make it that much more enjoyable to work in.
Q: Why does visualization make a difference?
A: I manage so many campaigns and so much data that it’s really, really important I can see things quickly.
I was getting so tired of transferring information from spreadsheet to spreadsheet to spreadsheet to figure out performance, among other things. Bionic has helped just to limit the number of steps in the process which is really, really helpful. It’s one system that does the full process.
For me it’s the best way to visualize the media plan as well. Spreadsheets are great for a number of different things. But they aren’t visually pleasing. Data should be presented visually.
A better visualization helps in making decisions.
It’s much easier to work with and just SEE where things are working and not working, if Saturdays have a big dip in the data, numbers themselves just might not jump out at you – especially in an agency where you are working on a lot of campaigns for a lot of clients. With this approach, you can really see the downfalls and opportunities of a campaign. We’re trying to optimize as best we can, so the easier it is to identify those the better – so we can make improvements faster.
To learn more and see demos, go to the Bionic for Agencies and Bionic Marketing Performance Management system pages on the Bionic website.