
Where are your advertising budgets being spent? Is your media buying in compliance? Here’s how a good media planning system can answer questions like these.
The Wrong Way to Analyze Your Media Buying Patterns
Without the right tools, it’s hard to analyze media buying spending patterns. You have to do a bunch of work just to get to the point where can start your analysis:
- Gather Data – If your media plans are in Excel spreadsheets, it’s a monumental effort to gather media buying data. If multiple systems are involved, you may have to hop from screen to screen to download your data.
- Clean the Data – You’ll often find the data you gather to be messy. Before you can start your analysis, you need to clean up your data. This means correcting and standardizing the data values.
- Load the Data – Now that you have clean data, it’s a good idea to load the data into a database.
- Create Reports – Finally, you’ll have to create the charts and reports you need to analyze your data.
Ugh… That’s a lot of work!
At best, all this work will slow you down.
At worst, you’ll contemplate all the work involved and decide to skip the analysis because the cost is too high. But the cost of not doing analysis may be even higher. You may never know.
What if you could skip all the grunt work? Imagine if you had instant access to up-do-date reports.
The Right Way to Analyze Your Media Buying Patterns
Bionic for Agencies give you a real-time view of your media buying patterns from every perspective. You can also export this data to Bionic Data Studio or your favorite reporting and dashboarding tools.
Analyze Media Buying by Campaigns
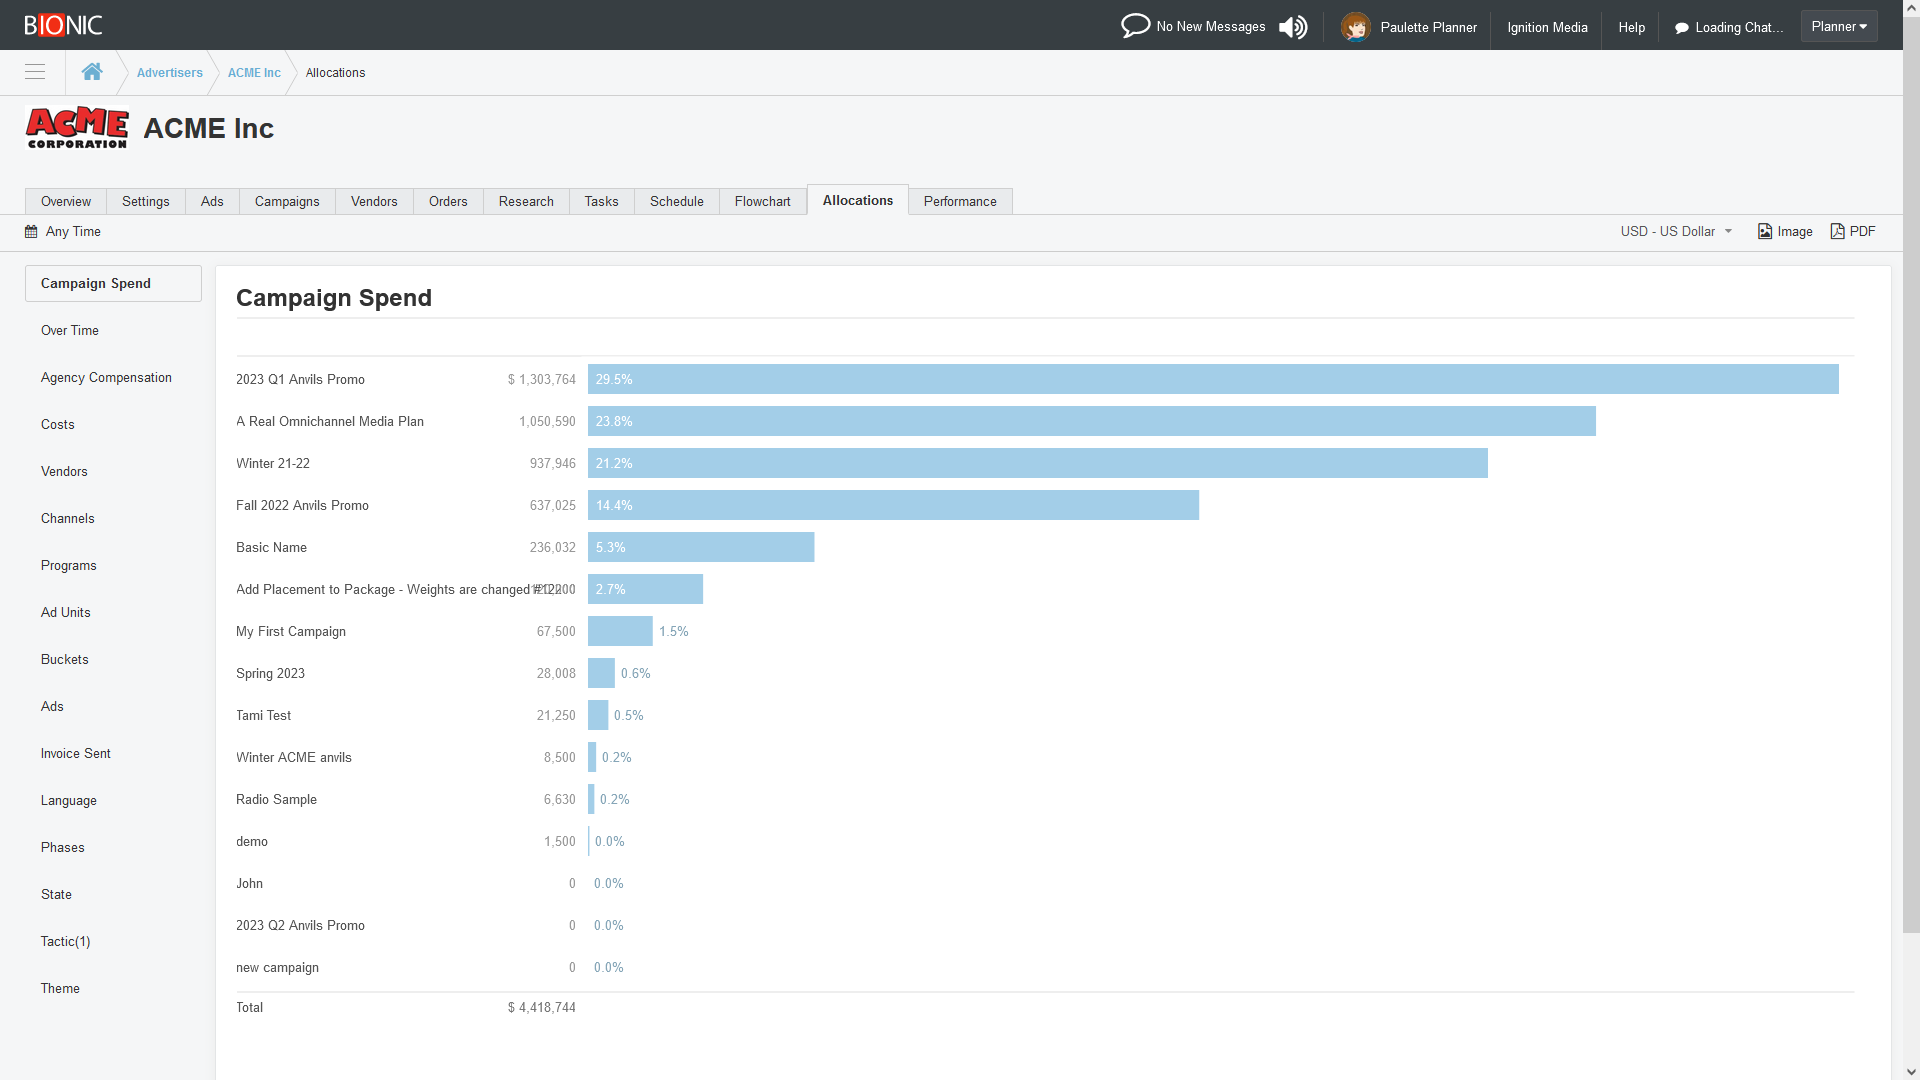
Bionic enables you to see which of your advertising campaigns are getting the biggest media budgets. You can see your media spending in any currency (Bionic will automatically exchange currency when necessary). You can also see each campaign’s share of the overall media buying in the selected time period.
Analyze Media Buying Over Time
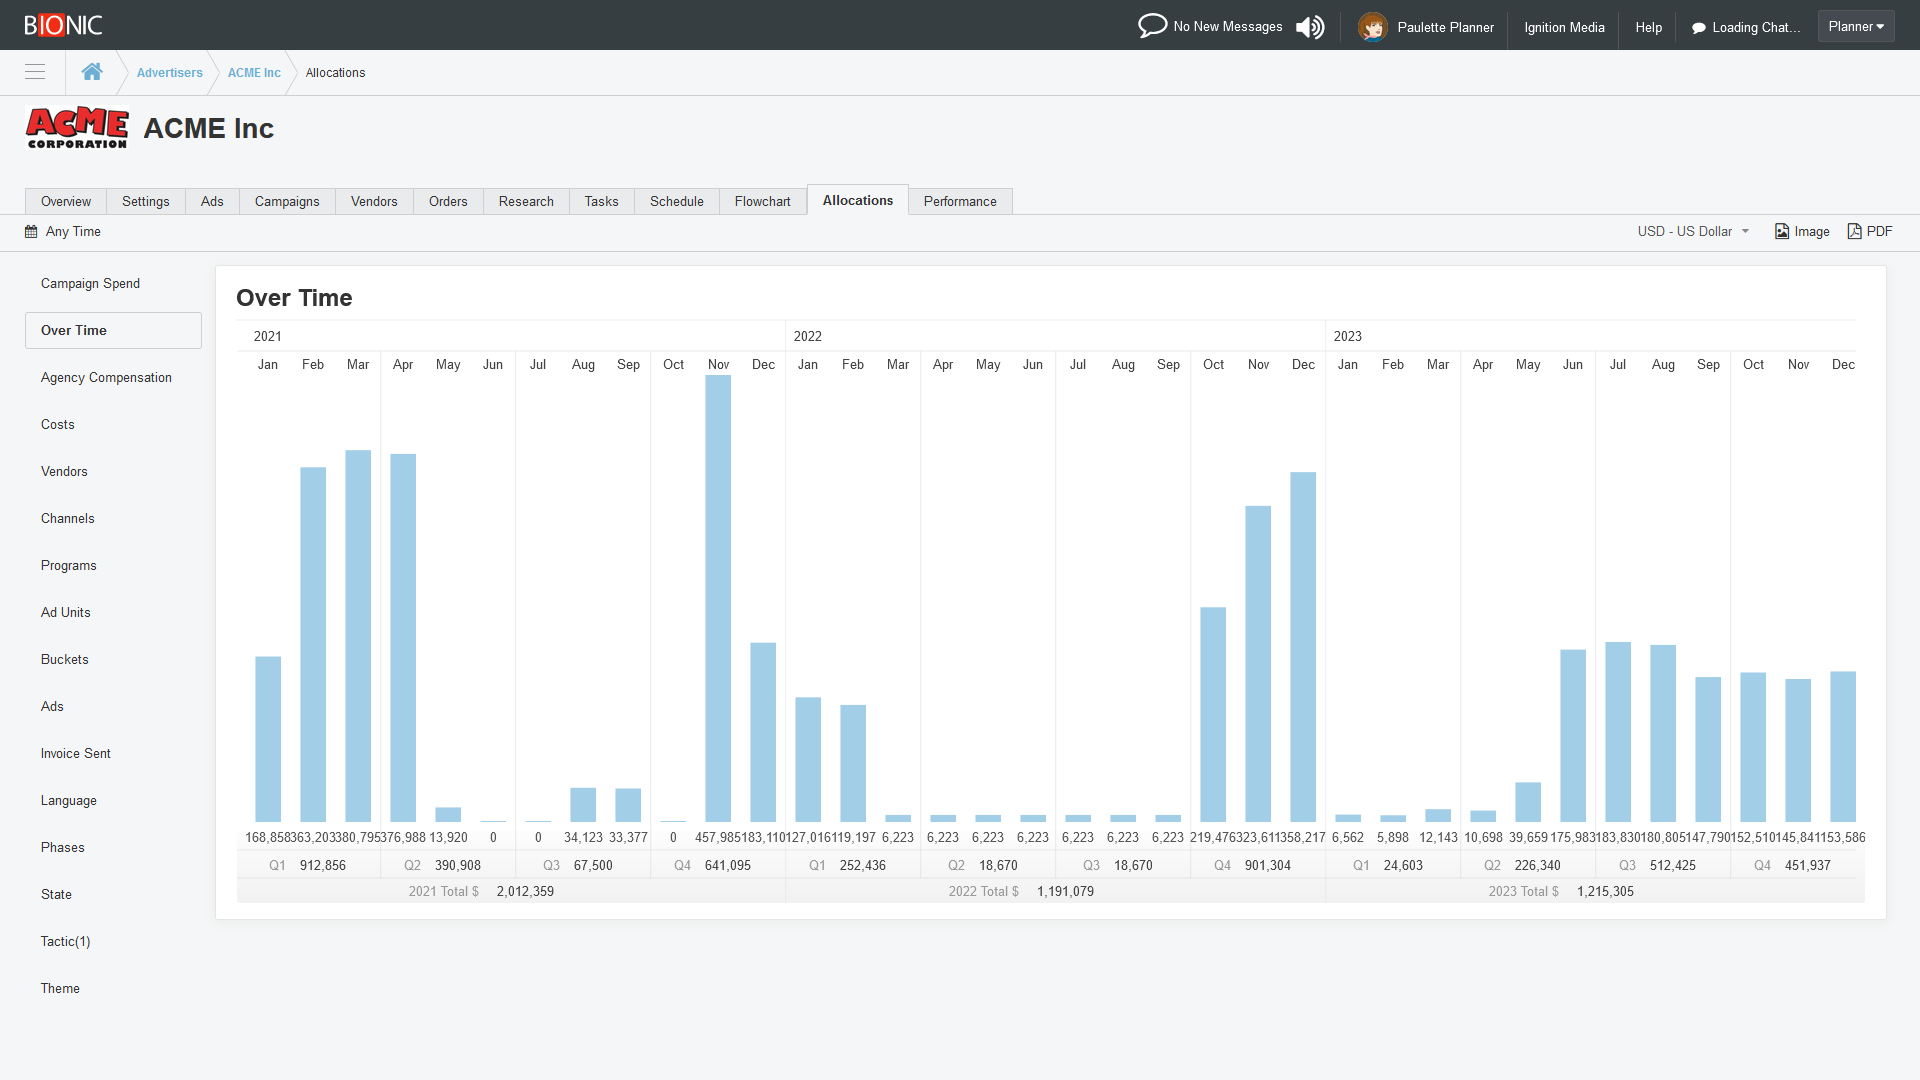
Bionic enables you to see your media spending over time. Your media buying is summarized by month, with quarterly and annual subtotals.
Analyze Agency Compensation Over Time
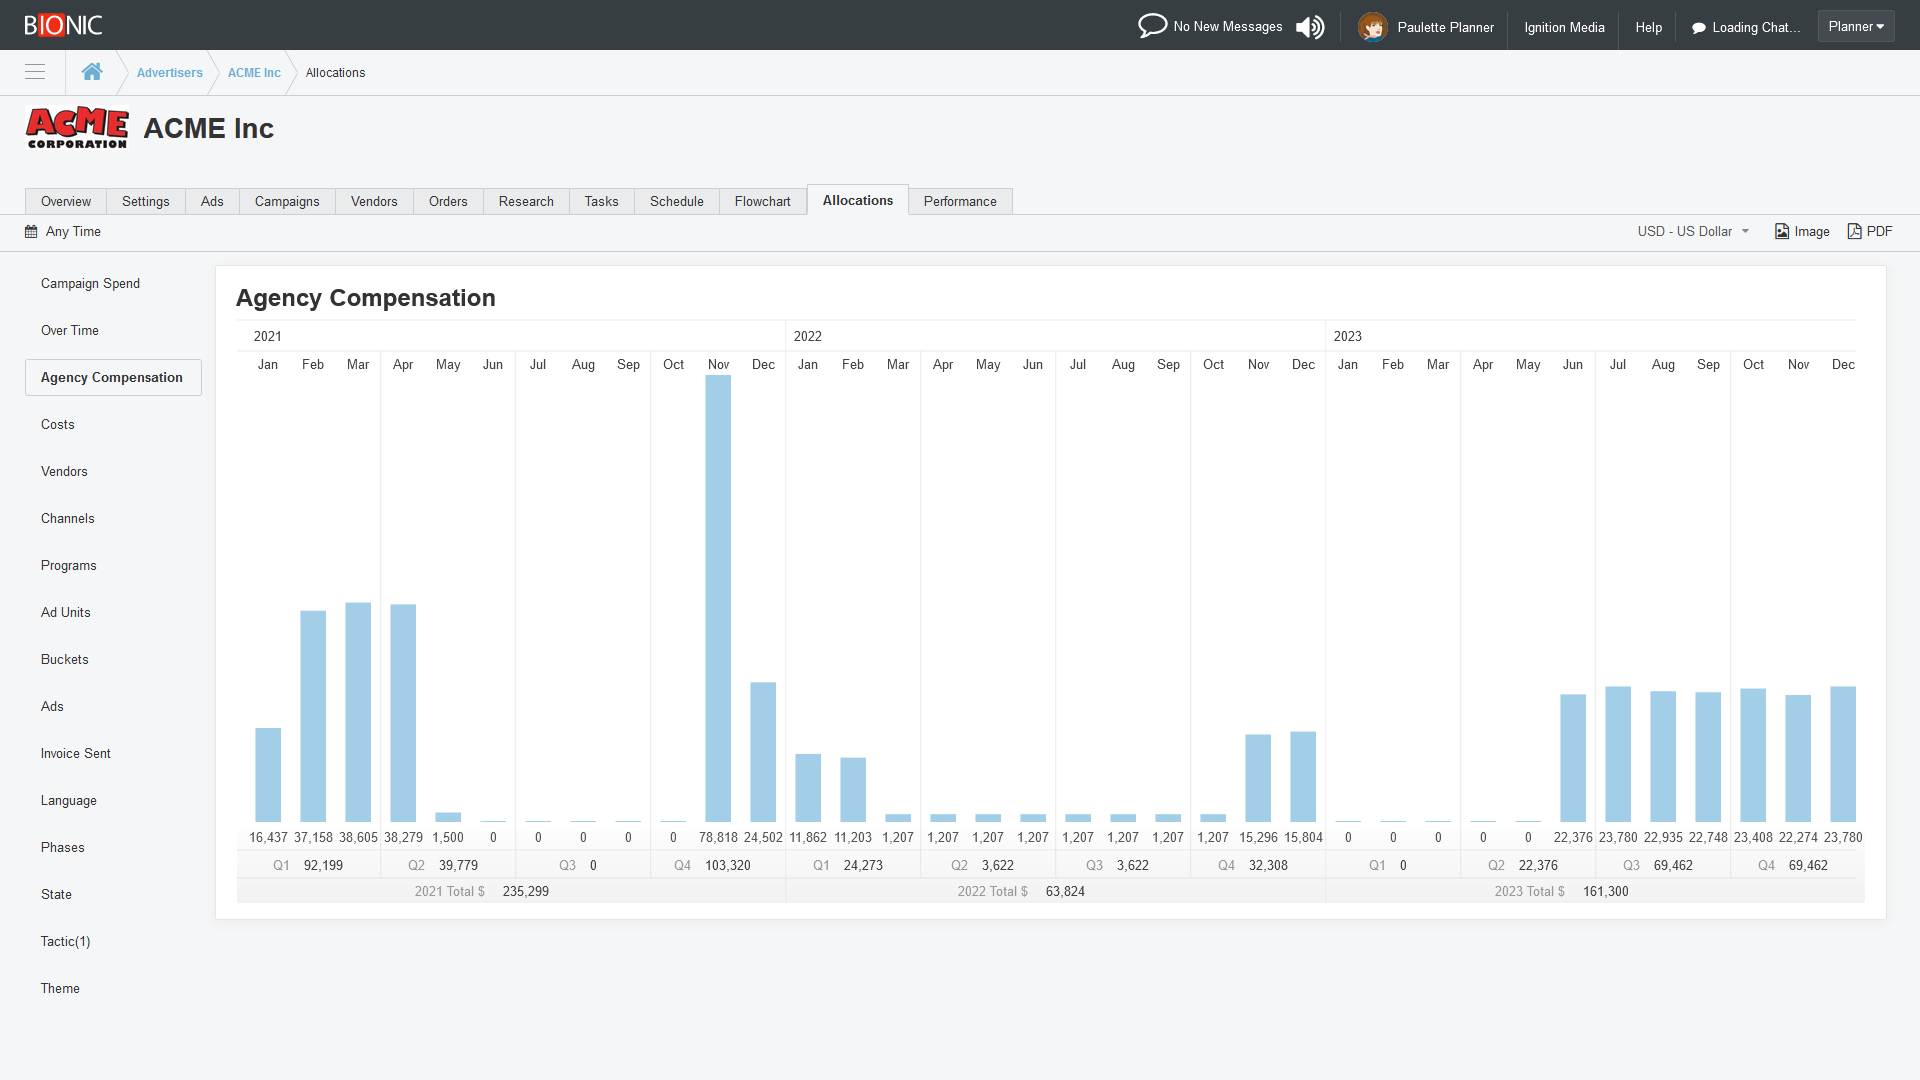
Bionic enables you to see your agency compensation over time. Like the other reports, you can see this for a given campaign, for a given advertiser or group of advertisers, or for your entire account (if you have the proper authority).
Your agency compensation is summarized by month, with quarterly and annual subtotals.
Analyze Media Buying Cost Breakdown
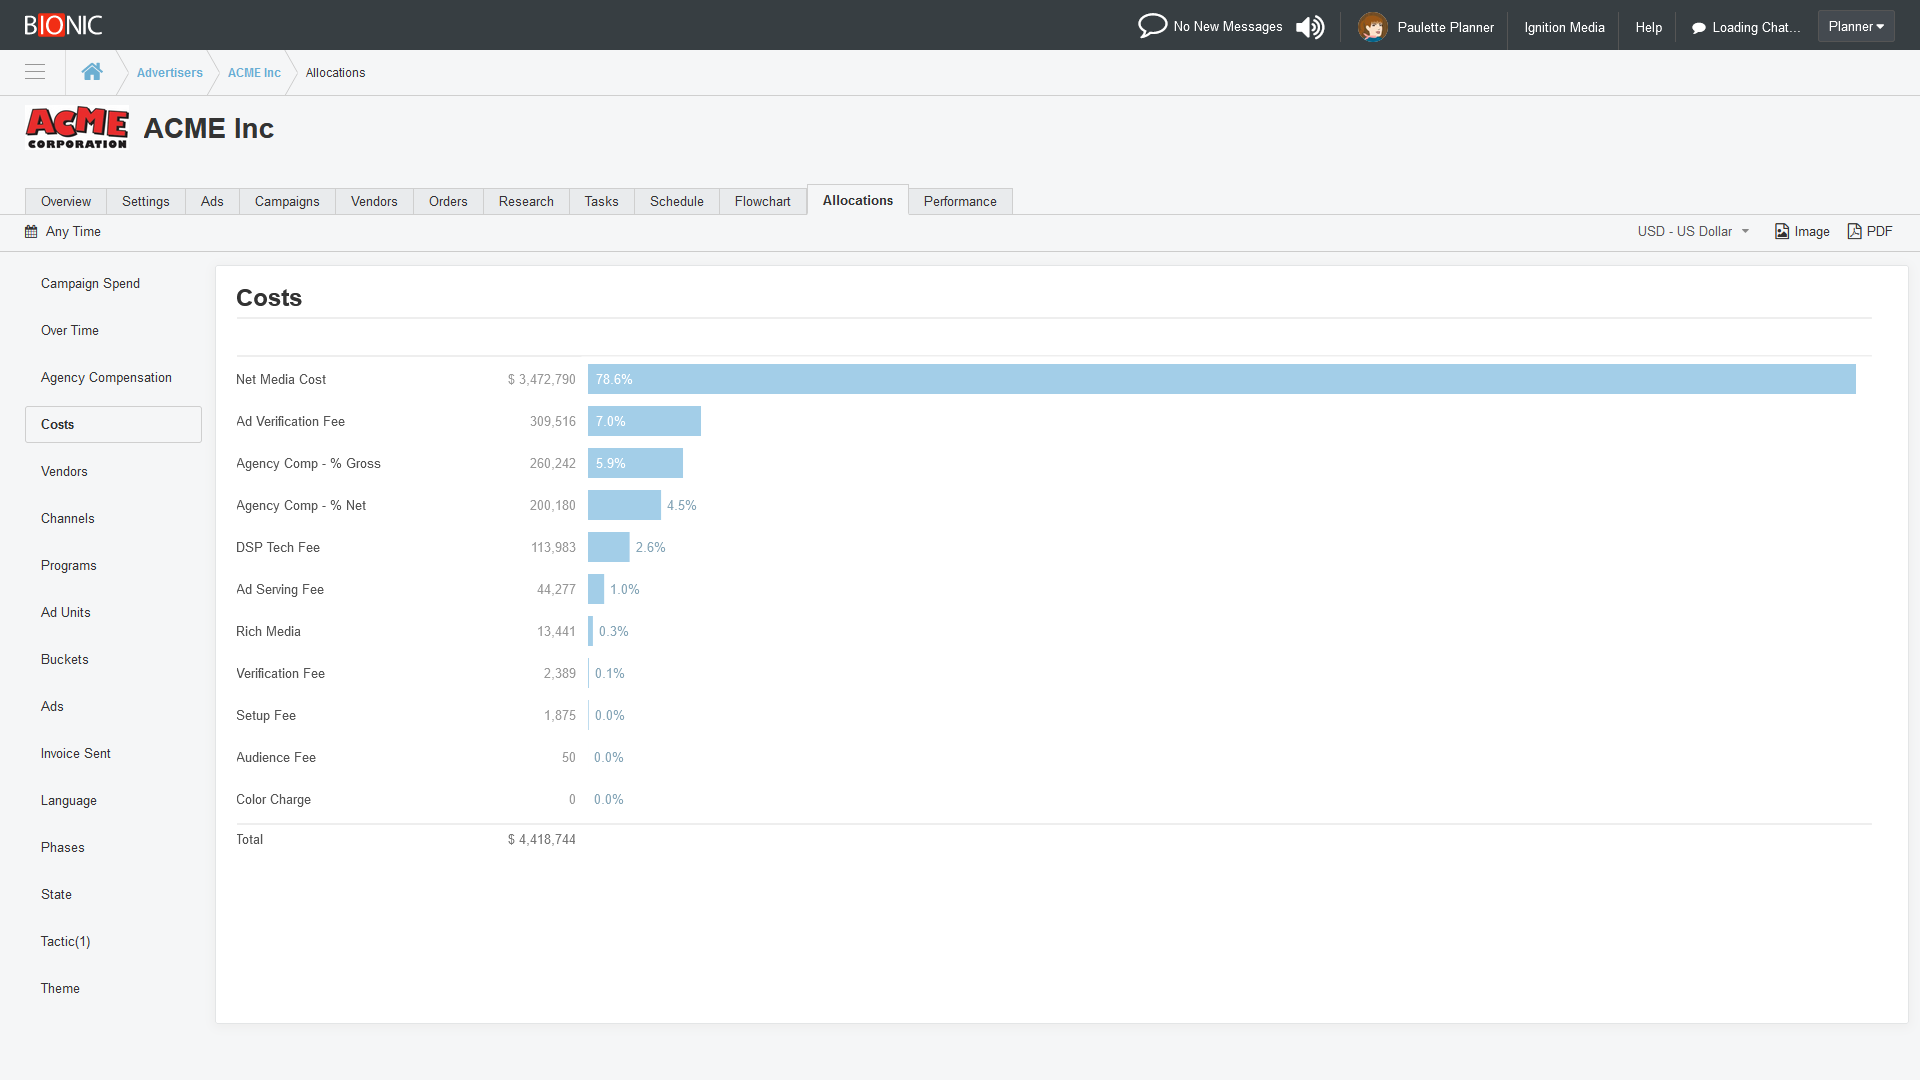
Bionic enables you to see how your media buying costs break down between net media cost (a.k.a. “working media”), agency compensation, various technology fees, and other fees.
This report is also known as “the waterfall” and brings much-needed transparency to your media spending. There are often “many hands in the cookie jar,” particularly in digital media. This report enables you to see who is getting your money.
Analyze Media Spending by Ad Creative
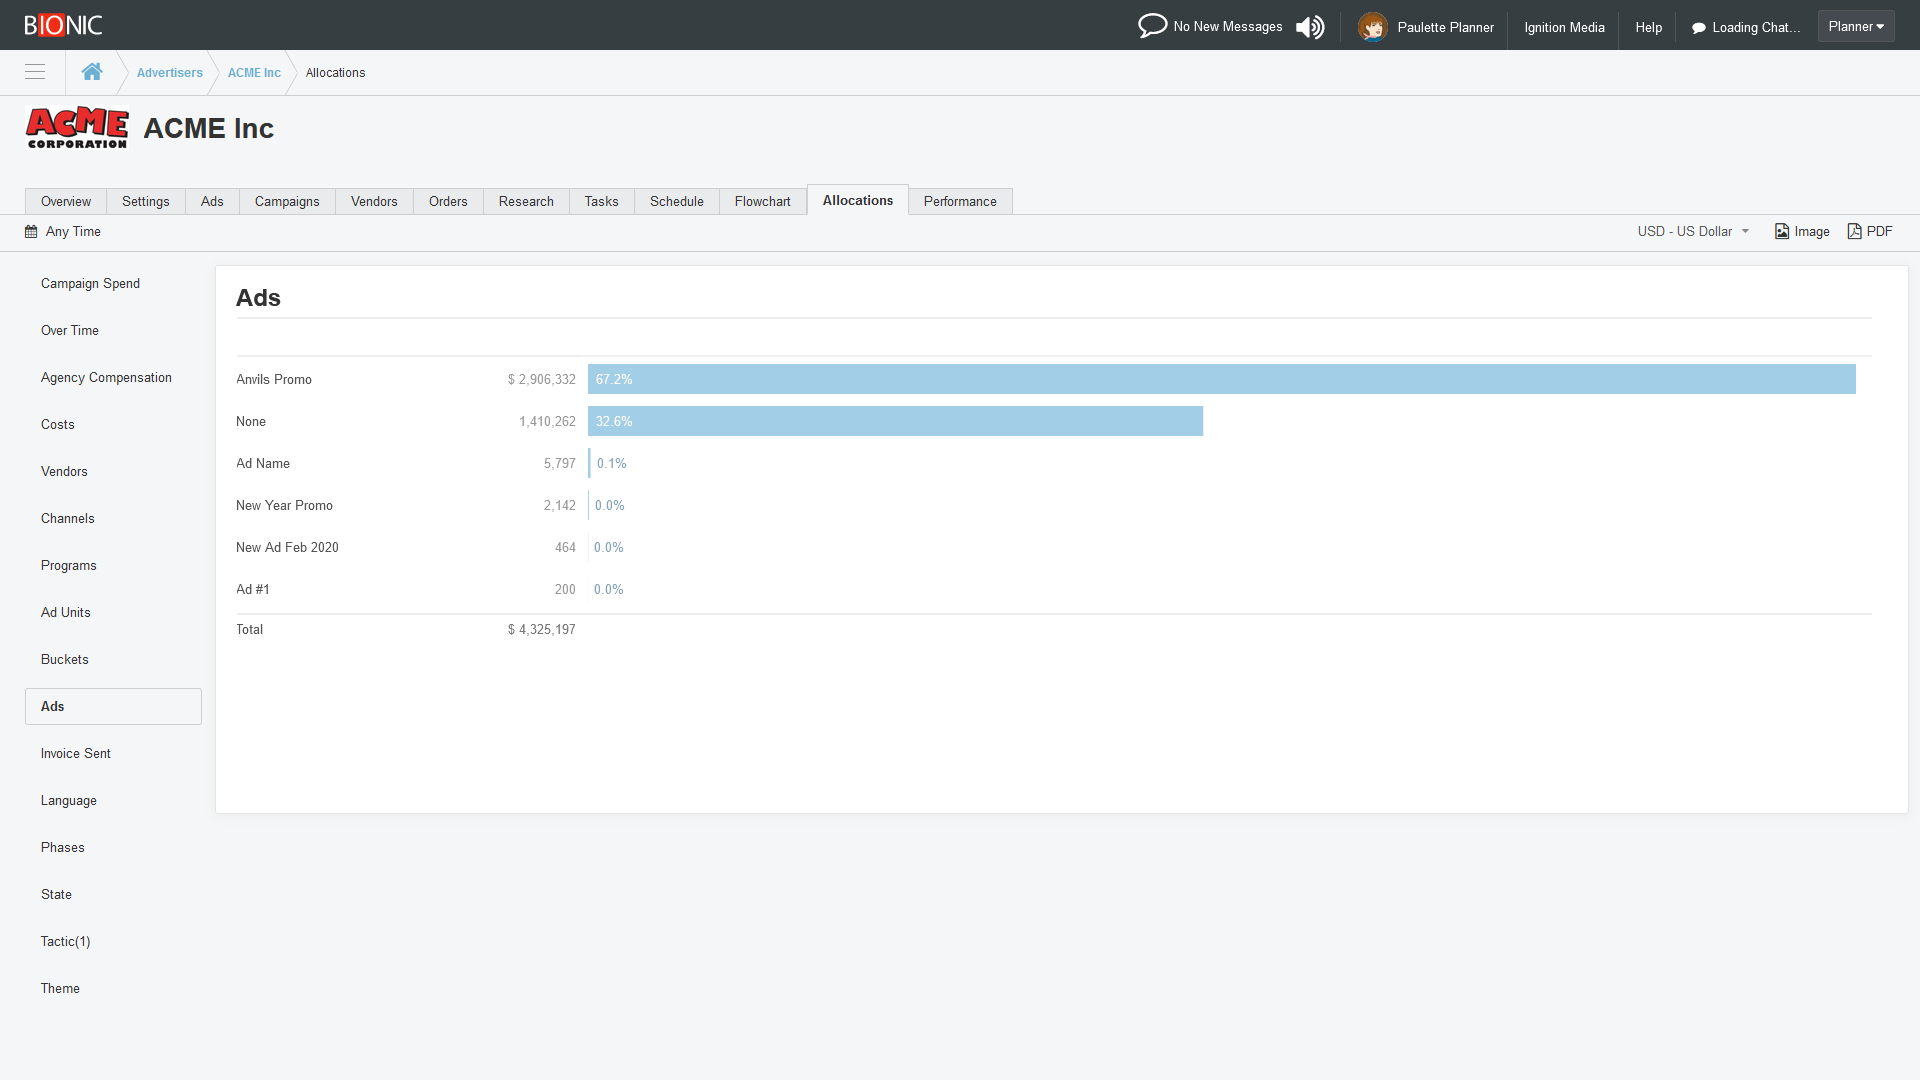
Bionic enables you to see if your advertising creative assets are getting enough media spending behind them to be effective. You spend all this time and energy creating these ads. Let’s make sure they are seen.
Analyze Media Buying by Vendors

Bionic enables you to see which vendors are getting the biggest shares of your media budgets. This gives you leverage in media negotiations.
Analyze Media Buying by Channels

Bionic enables you to see your media buying by channel. This helps you to ensure the proper media mix.
Analyze Media Buying by Programs
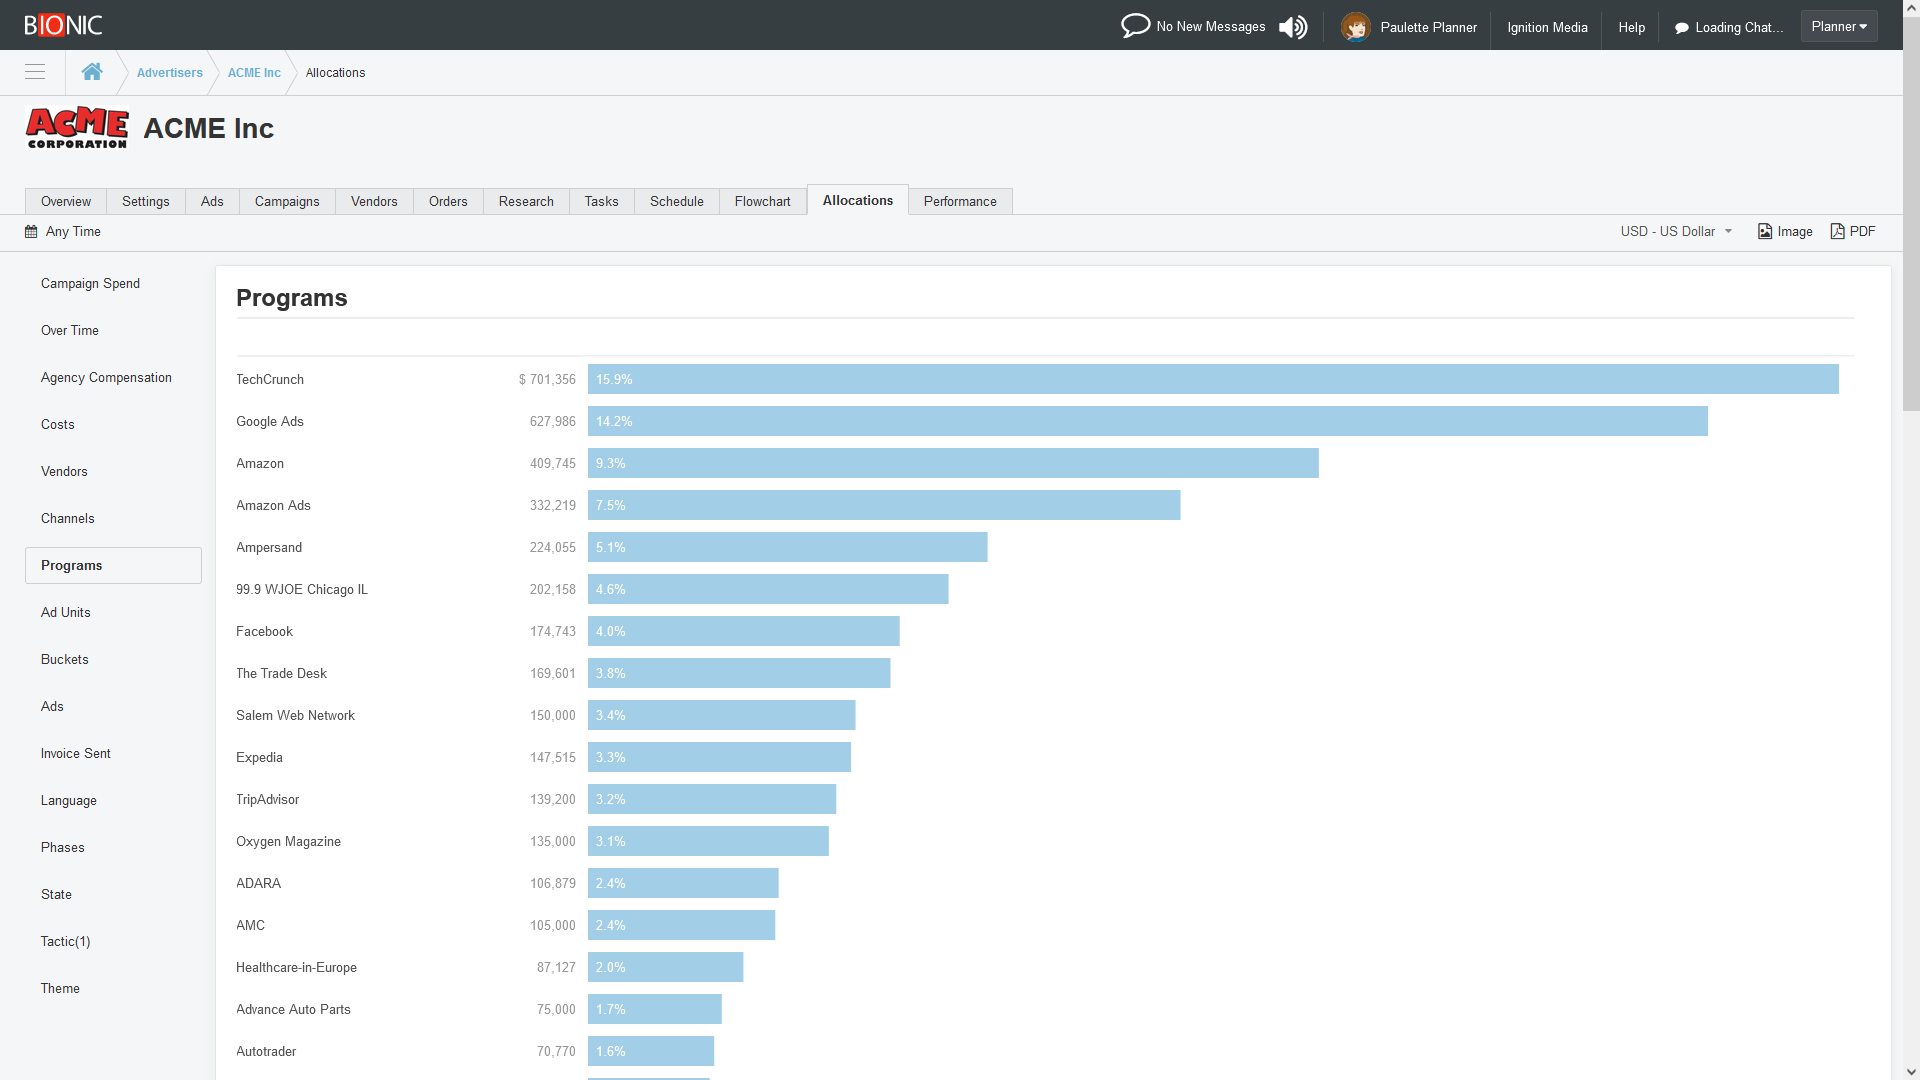
Bionic enables you to see which advertising programs are getting the biggest shares of your media buying. As with the other reports, you can apply a time constraint to report on a specific year or time period.
Analyze Using Your Custom Breakdowns

Any time you add a custom picklist column to your Bionic configuration, it becomes instantly available for reporting. No extra work is required to unlock reporting on your customizations.
This gives you reporting superpowers. Unlike with typically IT projects taking months, years, or not in this lifetime, this feature enables you to analyze your media buying in new ways in just a matter of minutes, with no special coding.
Analyze With You Own Dashboards and Reports
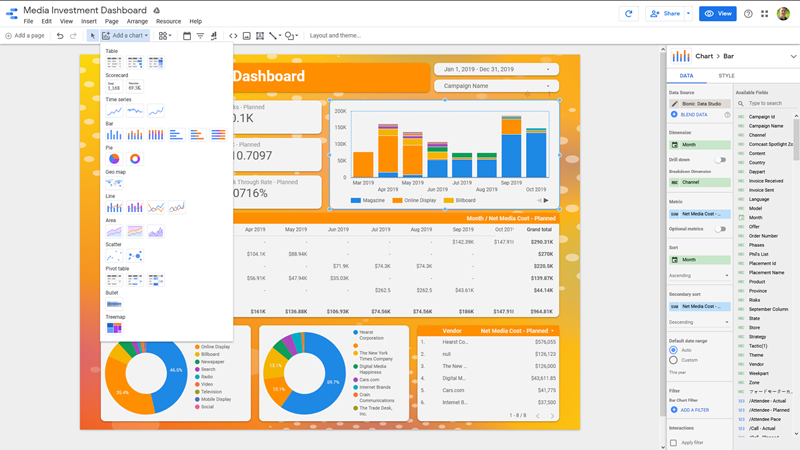
No matter how many standard reports we include with Bionic, you’ll always have a creative new way to analyze your media buying data. We fully support your ad hoc reporting.
Bionic includes a data pipeline that enables you to export your media plan data into your own reporting and dashboarding systems.
Don’t have a dashboarding system? No problem. Get started in minutes with Bionic Data Studio – a free dashboarding tool built on Google Looker.
Get Started Analyzing Your Media Buying Patterns
If you’re already using the Bionic for Agencies media planning and buying system, you already have access to everything mentioned above. Contact our Customer Success Team for help using these tools. Remember, your Bionic subscription includes free unlimited training and support.
If you’re not already on Bionic, what are you waiting for? You can start a trial today.