Bionic Advertising Systems, a leading provider of workflow automation solutions for advertising agencies, today announced the latest addition to its media planning software: Advertising Flowcharts. This powerful new tool enables media planners to instantly create Advertising Flowcharts and eliminates hours of unpleasant grunt work, eradicates tedious mistakes, and improves the visual quality of the Flowchart itself.
The Advertising Flowchart is one of the most important documents in a media plan presentation. It answers the advertiser’s burning questions in a concise visualization, including: what are we buying? How much are we spending on each placement? How is our budget allocated by channel? When will the advertisements run? How much are we spending by month, quarter, and year? How much are we spending overall?
The Advertising Flowchart conveys media plan information in such a powerful way that it’s often used as the primary document used in gaining approval to spend millions of dollars on an advertising campaign.
But there’s a huge problem with Advertising Flowcharts: they’re an absolute nightmare to create. Making the Flowchart is one of the most laborious tasks in the already expensive media planning process. It might literally take you days to create a flowchart for a medium-sized plan.
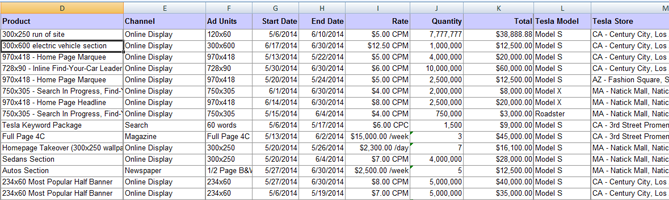
The reason that Flowcharts are so hard to create is because media plans are typically created manually using Microsoft Excel and all the raw data for the Flowchart are incarcerated in the cells of the spreadsheet: the placements, products, channels, start dates, end dates, amounts, etc.
The process to liberate the data from the spreadsheet and to convert it into a useful Advertising Flowchart is tricky and laborious. To give you sense of the effort, here’s how you might create one manually.
The old way: how to create an Advertising Flowchart manually
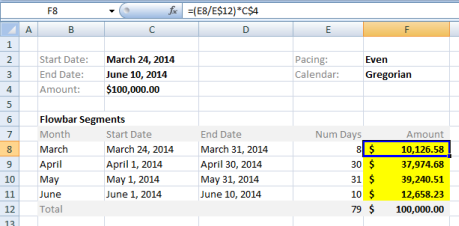
Step 1: Calculate the Flowbar Segments.
For each line on your media plan, break each placement into monthly components and allocate the spending ratably across the month components. For example, suppose you were spending $100,000 on a placement that runs from March 24, 2014 to June 10, 2014. You would start by determining how many days are in each month. Using the standard Gregorian calendar, the result would be March – 8 days, April – 30 days, May – 31 days, and June – 10 days for a total of 79 days. Then, to calculate the amounts for each month, pro-rate the placement amount for the fraction of the time period. In our example, the amounts would be March – $10,126.58, April -$37,974.68, May – $39,240.51, and June – $12,658.23. I had to use an Excel spreadsheet to figure out the calculations for this single line:
Repeat this process for every line in your media plan. You’ll want to set aside plenty of time to do these calculations and to double-check them. If your media plan contains 100 lines, you’ll have to do this calculation 100 times and diligently record the results of each.
Before you start this process, you’ll want to ask your client if they want their Flowchart to use the standard Gregorian calendar, the Broadcast calendar, or both. The Gregorian calendar is typically used in digital media. The Broadcast calendar is used in traditional media channels such as TV, radio, and print. The Broadcast calendar is quite different from the standard Gregorian calendar we use in our day to day lives. For example, on the Broadcast calendar, January 2014 starts on December 30, 2013, ends on January 26, 2014, and contains 28 days. For more examples, you will find a collection of Broadcast calendars on the Radio Advertising Bureau’s website. Depending which calendar you use, your Flowbar segment calculations will vary wildly. If you use the wrong calendar, you’re going to have to redo all these calculations.
Step 2: Calculate the Summaries.
Flowcharts are typically summarized by media channel. Your advertiser will want to see summary Flowbars for television, radio, billboard, online display, magazine, newspaper, and any other channels that are included in the media plan.
To calculate the summaries, bundle together all the placements for each channel then add up the amounts month by month and overall.
Depending on your client’s needs, you may need to summarize in different ways, such as by program, by vendor, by market, by strategy and in other ways. Repeat this process to calculate each.
Step 3: Calculate the Monthly Totals
Compared to steps 1 and 2, calculating the monthly totals is easy. Simply sum up all the Flowbar segments for each month to get your total. Again, be careful which calendar you are using – Gregorian or Broadcast.
Step 4: Lay out the results in a flowchart
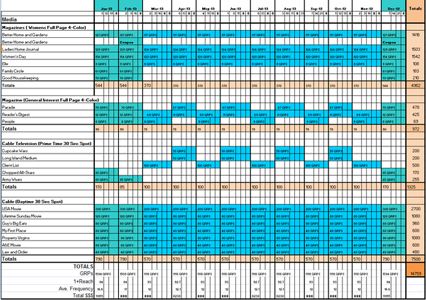
Now that you have all the raw data, you need to lay everything out in a flowchart format. Since media planners are not typically trained in graphic design and the tools to create a graphic presentation, they usually use Microsoft Excel to lay out the flowchart. The results aren’t pretty, but they get the job done. A typical manually created flowchart looks something like this:
Step 5: Rinse and Repeat
You may have already spent a few days of your life executing steps 1 through 4 above. It’s time to declare victory and celebrate, right? Not quite yet. Creating a media plan is an iterative process. It’s extremely rare to present the first draft of a media plan and your client and they respond with “By golly, you absolutely nailed it on the first try. Go with it.” More likely your client will ask for a bunch of changes: take that out, add this, more of this, less of that, move that over here … you get the picture. For each set of changes, you have to go through the steps 1 through 4 all over again.
Although Flowcharts are one of the best ways to present a media plan, creating them can be a hellish experience.
A Better Way: Creating Advertising Flowcharts with Bionic Planner
By now, you’re probably thinking “Advertising Flowcharts are great, but it’s crazy to create them manually. A computer should do it automatically. This is the kind of thing that computers are good at, right?” You’re exactly right. It is crazy that we humans have to do the work of machines. But until today, nobody has provided a way to turn your media plan into a flowchart without a ton of extra work. While standalone flowcharting tools have existed for some time now, they’re not widely used because they are disconnected from the planning process. They require re-keying the entire plan into the Flowcharting tool, which eliminates all the time savings.
That all just changed. Bionic has solved the Flowcharting problem for you in its latest software release, version 2.8.
Starting today, you can create beautiful and error-free Advertising Flowcharts with a single click of a button with Bionic for Agencies.
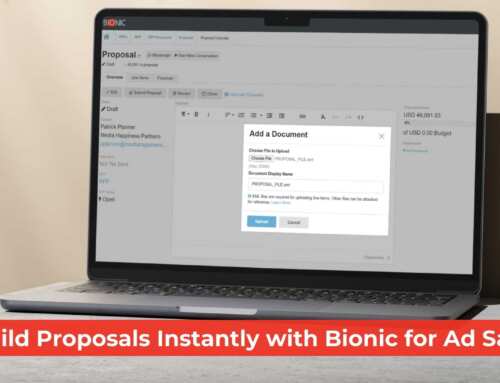
Easily create your Advertising Flowchart with the click of a button
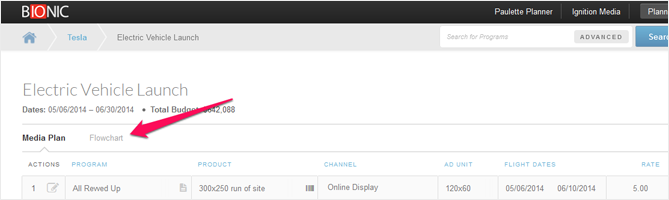
As you are working with your media plan in Bionic Media Planner, you can get an Advertising Flowchart by simply clicking “Flowchart” and – voila! – your Advertising Flowchart is instantly created. No more long hours of tedious grunt work and painstaking calculations.
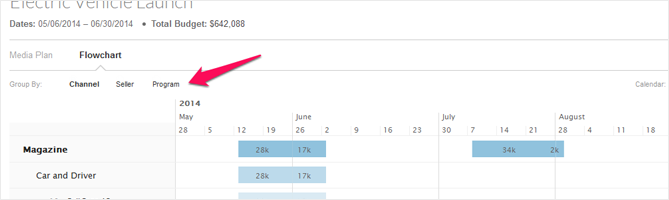
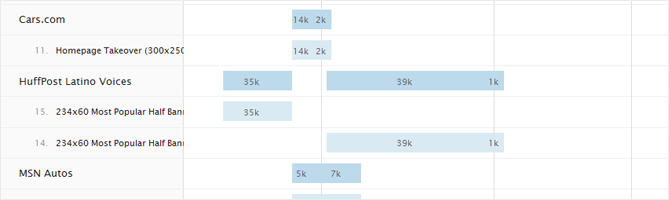
Quickly summarize your Flowchart exactly the way you want
Need your Flowchart summarized by channel? By vendor? By program? By something else in your media plan? With Bionic Media Planner, you can change your summarization strategy with a click of a button:
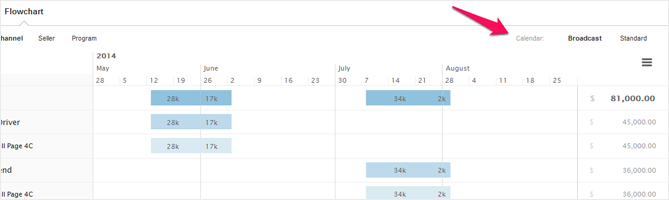
Easily switch between the standard Gregorian and Broadcast calendars
Do you have one client that wants their flowcharts in the standard Gregorian calendar and another who wants their flowcharts in the Broadcast calendar? And another who wants it in both? No problem. With Bionic Media Planner, you can switch between calendars at a click of a button.
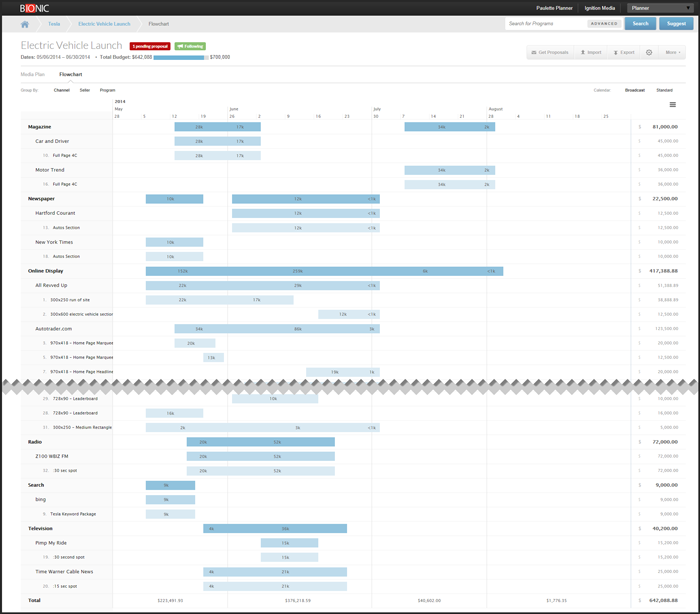
Create beautiful Advertising Flowcharts
Unlike the typical ugly flowcharts that your competitors present, you’ll impress your clients with beautifully designed Flowcharts created with Bionic Planner.
Put Advertising Flowcharts right into your client presentation
Bionic Planner gives you a variety of export options including PNG, JPEG, PDF, and SVG that make it easy for you to include beautiful Advertising Flowcharts in your client presentations in PowerPoint, Keynote, Word, Excel, and virtually any other presentation tool.
Want to try Bionic Media Planner and Advertising Flowcharts?
Finally, you can impress your clients with beautiful Advertising Flowcharts without the time and hassle of creating them the old way. If you’re already using Bionic for Agencies, simply bring up your media plan and click the “Flowchart” button. It’s as easy as that.
If you’re not already using it, request your trial of Bionic Media Planner.